VMware snapshots are a fantastic feature. They can be easily created. The problem arises when they have been forgotten about. Not only do they consume disk space, they can also take a very long time to remove. The check_vm_snap_size.ps1 plugin for Nagios/Icinga was written to notify when any snapshots get over a certain defined size. While other methods exist for checking snapshot file sizes (like running a check via the service console), this plugin uses the PowerCLI interface released by VMware to present that information. When utilized along with NSClient++ it can easily report back to Nagios the size of your snapshots. Combine that with your favorite performance graphing utility (ex. Nagiosgraph) and you show the growth of your snapshot sizes.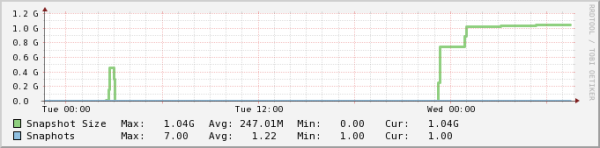
While the plugin itself is fairly simple (I am no PowerShell guru) the steps to get it operate securely with NSClient++ and to minimize load are somewhat involved.
Prerequisites
Installation and Configuration
The installation and configuration of the script is fairly straight forward by itself. The difficult parts are related to optimizing your PowerCLI environment to reduce the load time. Because the script is reloaded every check interval, without optimization this can put extra load on your host. The other piece is to generate a credential file so that you are not passing username/passwords across the network needlessly.
PowerCLI Optimiziation
Because the PowerCLI is loaded every time the script is run, we want to minimized its impact on the system. One way to accomplish this is to manually compile the .Net PowerCLI XmlSerializers; doing this dramatically reduces the CPU load and startup of time of the add-in. You will only need to do this once per computer per version of the PowerCLI. A big thanks goes out to VELEMTNAL and vNugglets for the commands to do this.
The following script is what I ran on my host, it complies all known versions that might be on the host (I was lazy and didn’t really want to figure out which version I actually had). Note that this script needs to be run as Administrator (right-click and select “Run As Administrator”).
For 64-bit Operating Systems
C:\Windows\Microsoft.NET\Framework64\v2.0.50727\ngen.exe install "VimService55.XmlSerializers, Version=5.5.0.0, Culture=neutral, PublicKeyToken=10980b081e887e9f"
C:\Windows\Microsoft.NET\Framework64\v2.0.50727\ngen.exe install "VimService51.XmlSerializers, Version=5.1.0.0, Culture=neutral, PublicKeyToken=10980b081e887e9f"
C:\Windows\Microsoft.NET\Framework64\v2.0.50727\ngen.exe install "VimService50.XmlSerializers, Version=5.0.0.0, Culture=neutral, PublicKeyToken=10980b081e887e9f"
C:\Windows\Microsoft.NET\Framework64\v2.0.50727\ngen.exe install "VimService41.XmlSerializers, Version=4.1.0.0, Culture=neutral, PublicKeyToken=10980b081e887e9f"
C:\Windows\Microsoft.NET\Framework64\v2.0.50727\ngen.exe install "VimService40.XmlSerializers, Version=4.0.0.0, Culture=neutral, PublicKeyToken=10980b081e887e9f"
C:\Windows\Microsoft.NET\Framework64\v2.0.50727\ngen.exe install "VimService25.XmlSerializers, Version=2.5.0.0, Culture=neutral, PublicKeyToken=10980b081e887e9f"
If you have a 32-bit OS use
C:\Windows\Microsoft.NET\Framework\v2.0.50727\ngen.exe install "VimService55.XmlSerializers, Version=5.5.0.0, Culture=neutral, PublicKeyToken=10980b081e887e9f"
C:\Windows\Microsoft.NET\Framework\v2.0.50727\ngen.exe install "VimService51.XmlSerializers, Version=5.1.0.0, Culture=neutral, PublicKeyToken=10980b081e887e9f"
C:\Windows\Microsoft.NET\Framework\v2.0.50727\ngen.exe install "VimService50.XmlSerializers, Version=5.0.0.0, Culture=neutral, PublicKeyToken=10980b081e887e9f"
C:\Windows\Microsoft.NET\Framework\v2.0.50727\ngen.exe install "VimService41.XmlSerializers, Version=4.1.0.0, Culture=neutral, PublicKeyToken=10980b081e887e9f"
C:\Windows\Microsoft.NET\Framework\v2.0.50727\ngen.exe install "VimService40.XmlSerializers, Version=4.0.0.0, Culture=neutral, PublicKeyToken=10980b081e887e9f"
C:\Windows\Microsoft.NET\Framework\v2.0.50727\ngen.exe install "VimService25.XmlSerializers, Version=2.5.0.0, Culture=neutral, PublicKeyToken=10980b081e887e9f"
UPDATE – Apr 4, 2017
If you are using Powershell 3.0+ then you need to run a different set of commands in order to make the optimizaitons. Thanks to a comment on a VMware blog post the command you need to run for a 64-bit OS is
c:\Windows\Microsoft.NET\Framework64\v4.0.30319\ngen.exe install "VimService55.XmlSerializers, Version=5.5.0.0, Culture=neutral, PublicKeyToken=10980b081e887e9f" /ExeConfig:%windir%\system32\WindowsPowerShell\v1.0\PowerShell_ISE.exe
Also according to another comment on the same post “This optimization is not possible and not needed any more with version 6.5+ of PowerCLI”
Credential Store Creation
The second challenge with running this script in an automated fashion via NSClient++ is related to authentication and user rights. The script has been designed to utilize the VI Credential Store features to securely save a credential file to the machine and then just pass that location in the command string so that you are not actually storing raw username and passwords or passing them across the network. The New-VICredentialStoreItem and Get-VICredentialStoreItem commandlets allow the file to be created, however the resulting saved files can only be utilized by the user account that created the file. Check out the PowerShell Article of the Week from Professional VMware for more information on secure credential storage.
By default the NSClient++ service runs as the local System account, so we need to launch a PowerCLI session as the System account if we want to utilize this feature.Thanks to a post on Ben Parker’s Blog called How do I run run Powershell.exe/command prompt as the LocalSystem Account on Windows 7? we have the answer. The trick is use PsExec from Microsoft/Sysinternals. Even though Ben’s blog post is specific to Windows 7 the process works just fine on Windows Server 2008 R2.
- Download PsExec from Microsoft
- Run PsExec from a command prompt as follows:
psexec -i -s Powershell.exethis will open a new window - In the new PowerShell console window type
whoamiand it should respond withNT AUTHORITY\SYSTEM - Create the XML Credential file by running
New-VICredentialStoreItem -host 'host.example.com' -user 'username' -password 'pword' -file c:\hostname.xmlsubstiuting the correct server, user, password and file locations. Note that the location you choose should have the necessary security rights applied.
NSClient++ Configuration
In order to make this script work with NSClient++ you must first make sure that your nsclient.ini is configured for external scripts and NRPE, additionally you need to enable support for argument passing and to allow for nasty meta chars (this last step may not be needed) for the scripts. Assuming you have placed the check_vm_snap_size.ps1 script in the NSClient++ scripts folder then should add the following to the [/settings/external scripts/scripts] section of the config file.
Two things to note, first this should all be on one line it is shown as wrapped to easier reading. Second the last dash - is required.
check_vm_snap_size = cmd /c echo scripts\\check_vm_snap_size.ps1 -hostname $ARG1$ -crit $ARG2$ -warn $ARG3$ -credfile $ARG4$ -hostexclude $ARG5$ -guestexclude $ARG6$; exit($lastexitcode) | powershell.exe -command -
Nagios Configuration
The Nagios configuration is pretty straight forward. The check utilizes the check_nrpe command for passing the request to the host. The following is an example of the configuration for the checkcommands.cfg portion.
define command {
command_name  check_vm_snap_size
command_line  $USER1$/check_nrpe -H $HOSTADDRESS$ -t 45 -c check_vm_snap_size -a $ARG1$ $ARG2$ $ARG3$ $ARG4$ $ARG5$ $ARG6$
}
For the services check you will need to create something like the following, the last two arguments are optional and they refer to hosts and guests that you might want to exclude from the results. The other thing to note is that both the check_nrpe command and the NSClient++ configurations require that all backslashes be escaped because they are special characters, therefore for each single backslash in your path to your credential file you must enter four backslashes in the service check config.
define service {
service_description  VMware Snapshot Size
host_name            hostname
check_command        check_vm_snap_size!vcenterserver.example.com!1024!512!c:\\\\credfile.xml!excludehost.example.com!excludeguest
use                  generic-service
contact_groups       vm-admins
}
Known Issues/Limitations
- While the check_vm_snap_size.ps1 script supports passing an array for both the hostexclude and guestexclude parameter options, that functionality does not yet work when sending via check_nrpe. You can specific a single host and a single guest, but not multiple.
Misc Notes
You may need to enable set-executionpolicy for both 64 bit and/or 32 bit PowerShell depending upon which version of NSClient++ you have installed.
To Do
The script still needs internal documentation written, as well as hopefully finding a solution to all of the known issues
The Script
Save the following as check_vm_snap_size.ps1
param ( [string] $Hostname = "",
 [double] $crit = 100,
 [double] $warn = 50,
 [string] $CredFile,
 [string] $HostExclude =@(""),
 [string] $GuestExclude =@(""),
 [switch] $help
)
$countLargeSnap = 0
$critcount = 0
$warncount = 0
$snapcount = 0
$crittsize = 0
$warntsize = 0
$snaptsize = 0
$LargeSnapNames = ""
$critSnapNames = ""
$warnSnapNames = ""

# parameter error checking
if ( $warn -ge $crit) {
 Write-Host "Error - crit vaule must be larger than warn value" -foregroundcolor "red"
 exit 3
}
if ( $Hostname -eq "") {
 Write-Host "Error - Hostname must be specified" -foregroundcolor "red"
 exit 3
}

#load VMware PowerCLI
add-pssnapin VMware.VimAutomation.Core -ErrorAction SilentlyContinue

# If no credential file specific use the account permission from the user running the script
# otherwise use the credential file to get the host, user, and password strings
if ($CredFile -eq "" ) {
 Connect-VIServer -Server $Hostname -WarningAction SilentlyContinue > $null
}
else {
 $creds = Get-VICredentialStoreItem -file $CredFile
 # check to see if the hostname specific matches hostname in credential file
 if ( $Hostname -eq $creds.Host) {
  Connect-VIServer -Server $creds.Host -User $creds.User -Password $creds.Password -WarningAction SilentlyContinue > $null
 }
 else{
  Write-Host "Unknown - Hostname specific does not match hostname in credentials file" -foregroundcolor "red"
  exit 3
 }
}

if ($global:DefaultVIServers.Count -lt 1) {
 write-host "Unknown - Connection to host failed!"
 exit 3
}

# Get the list of snaphosts to evaluate from the host, excluding hosts and
# guests if defined
$snapshots = get-VMhost | ?{$HostExclude -notcontains $_.Name} | get-vm | ?{$GuestExclude -notcontains $_.Name} | get-snapshot

# Loop through each snapshot and see any sizes exceed the warning or crital
# thresholds. If so then store their names and sizes. Could put into an array
# but that is for another day.
foreach ( $snap in $snapshots ) {
 $snapcount++
 $snaptsize = $snaptsize + $snap.SizeMB
 if ( $snap.SizeMB -ge $warn -and $snap.SizeMB -lt $crit ) {
  $warncount++
  $wVMName = $snap.VM
  $wVMSize = $snap.SizeMB
  $warntsize = $warntsize + $snap.SizeMB
if ( $warnSnapNames -eq "") {
    $warnSnapNames = "${wVMName}:${wVMSize}MB "
    }
   else {
    $warnSnapNames += "${wVMName}:${wVMSize}MB "
    }

        }
  elseif ( $snap.SizeMB -ge $crit  ) {
   $critcount++
   $cVMName = $snap.VM
   $cVMSize = $snap.SizeMB
   $crittsize = $crittsize + $snap.SizeMB
   if ( $critSnapNames -eq "") {
    $critSnapNames = "${cVMName}:${cVMSize}MB "
    }
   else {
    $critSnapNames += "${cVMName}:${cVMSize}MB "
    }
 }
}

if ( $critcount -gt 0 ) {
 Write-Host "Critical -" $critcount "VM's with snapshosts larger than" $crit "MB :" $critSnapNames "|snaps=$snapcount;$warncount;$critcount;; ssize=${snaptsize}MB;$warn;$crit;;"
 exit 2
}
elseif( $warncount -gt 0 ) {
 Write-Host "Warning -" $warncount "VM's with snapshosts larger than" $warn "MB :" $warnSnapNames "|snaps=$snapcount;$warncount;$critcount;; ssize=${snaptsize}MB;$warn;$crit;;"
 exit 1
}
if ( $critcount -eq 0 ) {
 Write-Host "OK - No VM's with snapshosts larger than " $warn "MB" "or" $crit "MB" "|snaps=$snapcount;$warncount;$critcount;; ssize=${snaptsize}MB;$warn;$crit;;"
 exit 0
}