Review: SB EventLog Monitor

SB EventLog MonitorI have only one thing to say about this product, “How did I ever live without it”. If you manage more than one Microsoft Windows Server then you definitely need to be using SB EventLog Monitor.

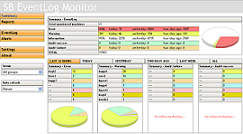
So what does SB EventLog Monitor do that is so great, it collects, collates, and reports via a web interface upon Microsoft Event Log data. The UNIX world has had syslog forever and a ton of tools to help you manage the logging data generated by servers. I’ve even tried to shoehorn Microsoft Event Log data into some of those products, but it was never a good fit. SB EventLog Monitor allows you to quickly and easily manage and analysis what is going on across all of your servers. It allows you to quickly and easily view and filter error messages from different servers and identify patterns. This is particularly useful with dealing with multiple servers across slow WAN links.

It collects the Event Log data either via a Microsoft VB script that use WMI to collect only the new events or via an agent that you can install on your servers. The other requirements are MySQL, PHP (5.0+), and a web server (apache, IIS). While the install is geared towards running everything on a Microsoft server it is possible to run the database and web server on Linux. In fact that is what I did. The install is really pretty easy, so if you are looking for a relatively simple way to increase the manageability of your servers, then I strongly recommend that you take the time to install the open source SB EventLog Monitor.

Cacti’s Painless Network Monitoring


For the past week I’ve submersed myself in the world of Cacti, and have been have a lot of fun making cool graphs. As my staff will attest, I’m really big into monitoring anything and everything on our network. I find it’s very helpful to be able to track usage, capacity, growth, and a bunch of other things. Without some kind of baseline how do you know if things are operating as they should?

Oh, so you’re wondering what Cacti is, well here is the developer’s description:

Cacti is a complete network graphing solution designed to harness the power of RRDTool‘s data storage and graphing functionality. Cacti provides a fast poller, advanced graph templating, multiple data acquisition methods, and user management features out of the box. All of this is wrapped in an intuitive, easy to use interface that makes sense for LAN-sized installations up to complex networks with hundreds of devices.

Anyway, I’ve been using MRTG for last 8+ years to graph utilization, etc. It was a great product, and I’ve built up a number of useful scripts and hacks to monitor all kinds of things from Windows boxes to printers to email queues. I’ve even built a neat menu system, but it was a real hack. It was hard to manage, add devices, or even make changes. I’ve followed the RRDTool world for a while (and even moved my MRTG configs over to using RRD), but never found a solution that was easy to use and had the flexibility I wanted/needed. That was until I stumbled across Cacti.

Cacti has a templating system that makes adding new devices easy, it as an active user community that is sharing their templates for graphs, and device monitoring. It is really powerful and actually quite easy to use. It even integrates with Nagios, although I have yet to accomplish that integration. In the coming weeks I’ll be sharing my adventures with the installation and configuration as well as some of the templates that I have used and created/modified. So stay tuned for further post about Cacti.

3 Techs and Back to Renting

Well Comcast finally showed up 30 minutes after they first called. The first tech got lost, so shortly after she finally arrived, another tech showed up followed by the shift supervisor (the neighbors were most impressed, one of them even got a free service call out of it).

They tested this, and looked at that, they replaced some connectors, made me a new patch cable, made numerous trips inside and out. Finally after all that, my trusty old cable modem wouldn’t even sync up anymore. So they installed a new cable modem, for which I get the pleasure of rent for $3/month. I’ll give it a couple of months, and then decide what I really want to do.

As Slow as Dial-up

Well if you’re reading this post then you are very lucky. In what seems to be a yearly event, my Comcast cable connection is horrible. When it is up, sometimes it is as slow as dial-up, and at best it is at DSL speeds. We are supposed to have a tech out Wednesday evening. Frustrating.

I think the problem is the Downstream SNR (Signal to Noise Ratio). According to Comcast’s site as well as others the number should be above 35 dB. Mine ranges from 27-33. So this combined with a weak signal in general is probably why it is so bad.

I found these details out by getting into the web interface to my cable modem. I have a Siemens SpeedStream 6101 cable modem. You can access the screens by open your browser to http://192.168.100.1 and using root as both username and password.